
How would Hurricane Harvey be different now?
- May 5, 2023
- 3 min read
A weather pattern began forming off the west coast of Africa on August 13, 2017. In the two weeks that followed, it evolved into a hurricane, a tropical wave and back to a hurricane again as it continued to travel westward. Eventually, it made landfall in Texas on August 25 as Hurricane Harvey.
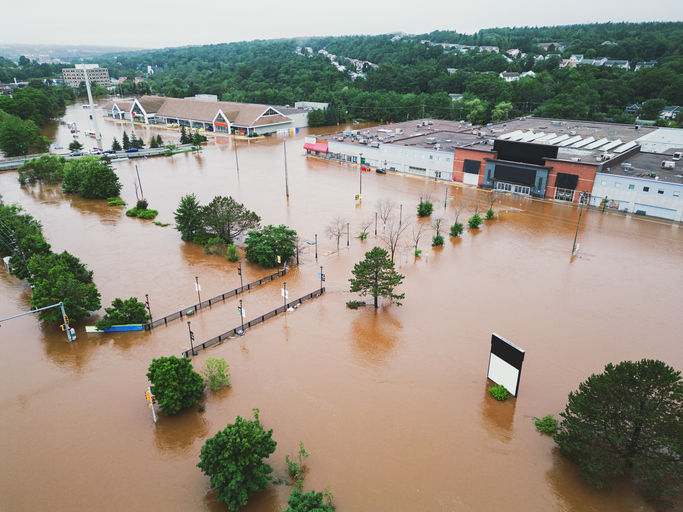
The Category 4 hurricane caused devastating impacts. According to the Federal Emergency Management Agency, more than 19 trillion gallons of rain fell over parts of Texas causing nearly 80,000 homes to flood by at least 18 inches and 23,000 of those with more than five feet. The Houston area, specifically, experienced the largest amount of rain ever recorded from a single storm in the continental United States. Hurricane Harvey broke flood records, evacuated 24 hospitals and nearly 780,000 Texans from their homes. The immense loss was tragic.
While some damage is inevitable, the World Bank has done a series of studies finding that 30-60% of flood damage is preventable with the right information and enough lead time to take action.
This is a common theme in a flood event – some emergency agencies and communities continue to struggle to understand the possible threat and impacts before, during and after a flood but we know it’s not due to a lack of information.
During an event like Hurricane Harvey, authorities issue weather reports, warnings and emergency alerts, media outlets report on the event and public safety organizations have response and recovery plans in action. Even with all of this, it’s often still a struggle to understand the potential flood impacts. Why? We believe it’s a lack of visualization. Until now, there has been no tool to visually represent an impending or unfolding flood event at street-level scale in real time.
Enter: FloodMapp.
FloodMapp has developed world-first flood modeling technology - Dynamic Automated Scalable Hydraulics (DASH). DASH is a computationally efficient flood modeling solution that is purpose-built for flood forecasting and hyper-local warning. If emergency managers and authorities had access to a street-level map of Hurricane Harvey’s predicted flooding extent before it flooded, how would that have altered the outcomes as we know them now?
With the information that was available at the time Hurricane Harvey made landfall, it was difficult to pinpoint exactly how much rain would fall over the Texas area and where the subsequent flooding impacts would be.
Having access to real-time data, visualized as flood extents and depths on a map, agencies are provided with unrivaled situational awareness that shows how a hurricane’s rainfall will result in flooding across the city, county or state. This enables authorities to be one step ahead of the event and take action early to limit its impact.
The following GIF shows how FloodMapp ForeCast and NowCast works during the evolution of Hurricane Harvey as it approaches the city of Houston(focusing on the Brays Bayou watershed) which experienced significant flooding and widespread damage as a result of the hurricane.

After now seeing the dynamic situational awareness FloodMapp’s data can provide, imagine that this intelligence was available at the time of Hurricane Harvey. How would access to this information have assisted with emergency response and possibly lead to different outcomes?
As the United States prepares for another hurricane season, we’d love to talk more with you about how real-time flood intelligence, visualized via localised impact maps, is a vital tool for the preparation, response and recovery phases of a hurricane and associated flood events. If you’re interested in learning more, please contact us via hello@floodmapp.com
The images above was taken from our latest webinar. If you found the video useful, you can view the webinar here: https://ww2.floodmapp.com/webinar-recording


Fantastic piece! Really appreciate the thorough reporting and clear explanation of such a complex topic. LGU+ 소액결제 현금화 This is exactly the kind of journalism that keeps us all informed and engaged!
xosoplus.mobi dạo này thấy bạn bè nhắc hoài nên mình ghé thử cho biết, kiểu vào xem giao diện họ làm ra sao thôi. Ấn tượng đầu là tiêu đề chia theo ngày nhìn khá rõ, lướt cái là thấy ngay mục XSMB ngày 19 07 2026 với phần dự đoán cho 20 7 2026 nên khỏi phải đoán đang nói kỳ nào. Mình cũng thích cách họ trình bày dữ liệu dạng khối, nhìn không bị ngộp chữ. Cái bảng “Đầu lô tô Đuôi lô tô” để riêng thành block nên mắt bắt nhanh, kéo xuống là thấy liền chứ không phải mò trong đoạn dài. Nói chung vào xem vài phút là nắm được bố cục, nhất là…
Fantastic reporting! Learn more here This piece really breaks down a complex issue in such a clear and engaging way. Thanks for keeping us informed with such quality journalism!
Wow, it's crazy to think how much rain Harvey dumped. I wonder if the mouse on my weather computer would even scroll through all that data without jittering. I actually used mouse-test to check mine recently.
7c777 came up in a chat, so I poked around for a minute just to see what the site feels like. Didn’t dive into the actual content much, but the layout made sense fast. The main menu is right there where you’d expect it, so you’re not clicking in circles trying to find stuff. I also liked how the page is broken into neat sections instead of dumping everything into one long chunk, so it’s easy to skim without getting lost. Nothing fancy going on, just clean and kind of calming to look at. Even when you scroll, it still feels organized because the headings and grouped blocks keep the page structure obvious. The menu placement and those tidy content…