
Satellite Imagery vs Real-time Intelligence
- Jul 15, 2022
- 4 min read
When we explain what FloodMapp does, many people often assume we use satellite data. It’s a fair assumption. If you're from the civil engineering field, you would know that traditional models would hit computational barriers and struggle with simulating areas that large (without compromising on resolution or speed).
If you’re not from a civil engineering field, you’ve probably seen how emergency managers use aerial imagery to detect bushfires. Furthermore, we always tend to view these models in GIS tools that give a perspective from space.
At FloodMapp, we rely solely on real-time models to simulate flood extent before, during and after a flood event. We know what you’re thinking: “all models are wrong, but some are useful”. The old saying is so true, and as such, we are constantly trying to update and validate our models.
One of the tools in our toolbox for model validation is satellite imagery. It’s a great way to see what’s happened over a massive area at a point in time and helpful for validation. But there are some real limitations with satellite imagery as a single source of data. Not only does it have to be in the right place, at the right time. It has to be equipped with the right sensors to penetrate the cloud cover.
We discuss these challenges below and the benefits of using real-time flood intelligence to enhance flood emergency preparation, response and recovery.
Peak timing
A satellite often gives you just a single snapshot per orbital period. But floods peak at different places at different times. So more often than not, satellite imagery doesn’t give you the full picture.
Firstly, satellite imagery cannot provide intelligence before or during an event, only after the event, when the flood waters have inundated land, and the satellites capture instantaneous imagery of the flood waters. It is therefore a powerful tool in viewing some impacted areas after the flood, but it cannot forecast flooding and therefore is not helpful in preparedness and response during the event.
That is where flood forecasting and real-time intelligence technologies like FloodMapp’s DASH model become valuable.
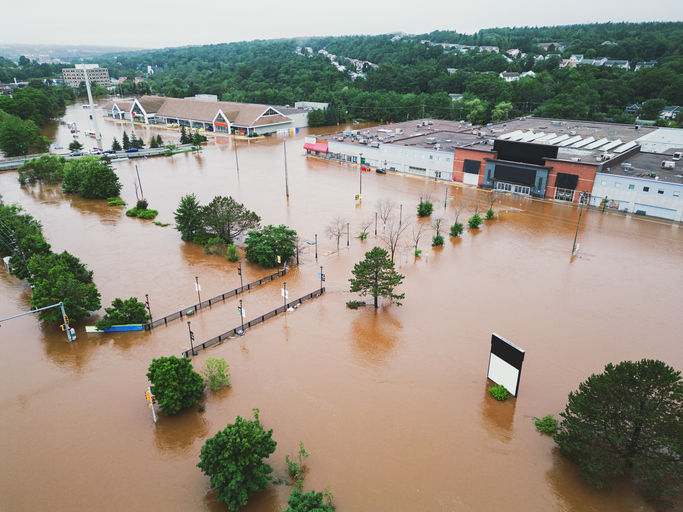
FloodMapp's PostCast results for flood inundation extent (think high water marks) during the February 2022 floods in Queensland, Australia, versus observed flooding extracted from satellite imagery. In the image below, we have overlaid our maximum inundation extent output, against the observed flooding extracted from the satellite imagery of the same event in Brisbane River catchment. FloodMapp PostCast (pink) and satellite coverage (blue), taken close to the peak of the flooding in this river. You can see that satellite layer shows a minor looking creek line through Oxley, whereas the FloodMapp layer shows significant flood inundation extent in Oxley. This is because when the satellite imagery was flown, the Oxley river flooding had receded, draining into the Brisbane River. Additionally, the observed extent extracted from the satellite image was unable to detect flooding in some areas.

In the next images, we have overlaid FloodMapp Nowcast (red outline) with the satellite imagery (dark blue) for the exact same timestep after the flood peak. The first image is for Logan River, the second is the Hawkesbury Nepean.
They both show a very strong match, demonstrating a very high model accuracy. Imagine having an accurate map of the flood inundation and impacted areas not after the flood, but before and/or during the flood. This is the value of FloodMapp ForeCast and NowCast.


Satellite imagery is very valuable for model validation. However, flooding is dynamic and changes every hour based on how the water is moving down the catchment. That’s why at FloodMapp we prioritize actual values from dynamic numerical modelling based on ingesting real-time weather and river height data.
Cloud Cover
Occasionally if the catchment is large enough or the flood long enough, you can get “sunny day” flooding. However, as most residents of the east coast can attest - it just kept raining. This means that there are often many clouds around.
In the picture below, you can see the impact cloud cover can have on certain satellite modelled results. Please don’t let us convince you that satellite imagery doesn’t have it’s place. There are sensors in orbit that are equipped with new technology, but you have to use the right tool for the right job.
We have demonstrated these challenges with some comparisons we prepared for the recent Gympie flood event. We looked at flood extent results derived from satellite and the satellite imagery for Gympie. The extent results are from 27-02-2022 19:09 UTC and the Image is from 28-02-2022 00:04 UTC so approximately 5hrs apart. The peak of the flood from the Gympie gauge is 26-02-2022 19:00 UTC, so these images are 24hrs and 29hrs after the peak respectively. The water levels have dropped 2.55m and 3.25m respectively from the peak.
The first image below shows the satellite image (false colour urban) where the blue areas on the image are the areas identified in the satellite imagery as water surfaces. This is compared with a satellite flood extent product, shown in red. Two things are noticeable in the first image, firstly there is a significant amount of cloud around and as such, the generated extents have missed significant areas of flood inundation.

The second image shows the satellite image (false colour urban) with the FloodMapp NowCast results extent at 28-02-2022 00:00 UTC as a yellow border. The extent matches the blue areas very well.

The FloodMapp models were not impacted by cloud cover and provided emergency services with a reliable, dynamic data feed of live flood inundation conditions updated hourly throughout the event. This intelligence is critical in maintaining situational awareness and a common operating picture before, during, and after a flood event, for making informed decisions on the ground to improve safety and prevent damage.


Reading how satellite imagery missed the Oxley flood extent due to timing, and how cloud cover can block sensors, really shows the gap between a snapshot and real-time flow. It makes me appreciate tools like a text to emoji translator for adding instant clarity in daily chats – like when I’m scrolling through news on the train and want to express a quick reaction without typing a paragraph, you know?
This comparison really highlights how vital real-time data is when you're facing a crisis and every second counts for your family's safety. I remember a bad storm where our traditional connection failed, and having access to a reliable starlink customer service phone number was incredibly helpful for getting our satellite back online quickly. Being able to reach actual support during an emergency provides such an immense sense of relief and security.
Another interesting thing about heardle is how it shows each of us has blind spots in music knowledge. You might be an expert in rap but terrible with rock. Or maybe you know every 80s song but can't name modern hits. Heardle gently exposes those gaps in a playful way, giving players chances to grow their music library organically.
Visual Speed Stars simplicity highlights the runner’s motion, focusing attention on rhythm and speed, while clean graphics ensure you’re never distracted, creating an immersive sense of sprinting intensity in every race.